
© Copyright 2015 - FX Hometrader - All rights reserved.

Candlestick Trading Tutorial
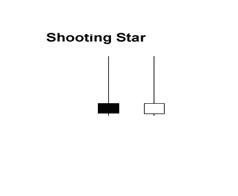
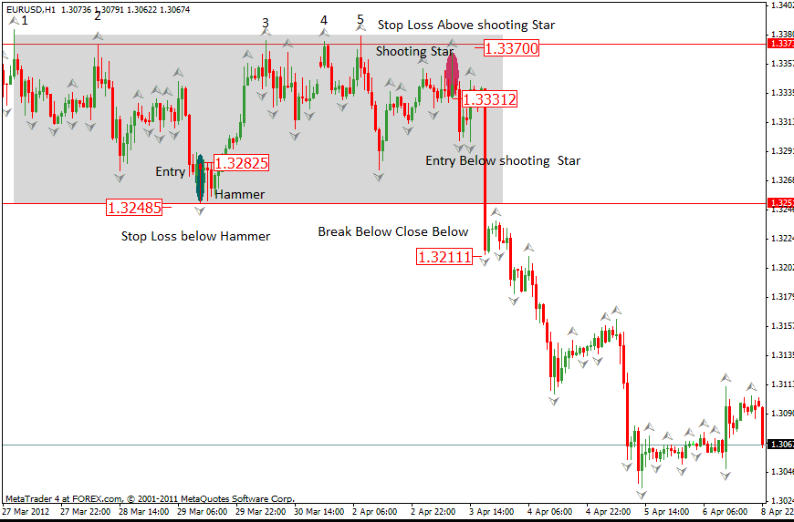
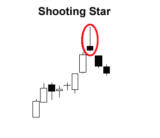
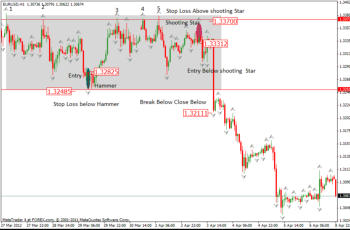
Each candle tells a story and represents the price movement (depicting the HLOC or high, low, open and close for a specific time interval.) Each candle displays an absolute value; but also allows us to easily compare current price movement to previous price movement. Over the years many simple candle patterns and some rather complex patterns have been identified to help traders identify potential price reversals or continuations. On the following chart we are going to identify 2 simple candle formations to identify price reversals. The Hammer The above depicts a hammer candle which is identified by having a very long wick (shadow) and a very small body with little or no upper shadow (wick). This candle is normally significant when it appears after a down trend in the market and signifies a potential reversal in price. The psychology behind the candle is that the bears were in control of the market at the open of that candle indicated by the prior down trend. The bears attempted to take price even lower but the bulls intervened strongly causing the candle to close near its opening price signifying that at the close of that candle the bulls were now in control. The candle is only relevant when appearing at the bottom of a down trend. The shooting star appears at the top of an uptrend and is depicted by a candle with a long upper shadow (wick) and a short body with little or no lower wick. The candle is relevant when it appears at the top of an uptrend and signifies that the bulls were in control to that point, they tried to take price higher but the bears intervened and pushed price lower causing the candle to close near its opening price. On the following chart we can identify trading opportunities with these two candle formations. On the above chart we can see that after a significant up move price consolidated and traded in the same range for many days before breaking out short. Price stalled 5 times at the high failing to continue the uptrend. The shaded area shows the consolidation range where price failed to make any new highs or lows. During that period we had a hammer formation signifying a price reversal (Green shading) We enter the trade when price breaks above the hammer candle with our stop loss below the low of the hammer candle Entry 1.3282 stop loss 1.3248 and our take profit at the resistance top where price stalled earlier. A stop loss of 34 pips and a profit potential of almost 100 pips making it a very good risk to reward trade. The next trade was signaled by the shooting star (red shading) and once again we entered the trade when price broke below the shooting star candle with our stop loss placed above the high of the shooting star. The profit target was the low of the consolidation range at around 1.3248 a 39 pip stop loss with an 83 pip profit potential. Price then broke below the lower range of the consolidation area with a large engulfing candle confirming the end of the prior up trend and the possible start of a new down trend. To confirm the breakout from the engulfing candle price must close below the previous support line, we then wait for price to break below the low of the engulfing candle to enter a new short trade. Without using any other indicators we were able to do 3 trades using candle formations, we were also able to establish the failure of the uptrend to continue when the strong resistance structure was not breached. We were also able to identify the start of the new trend showing that price action and candle formations are capable of identifying good trading opportunities without using lagging indicators. Obviously the more cautious trader can certainly combine other indicators to confirm trades signaled by candle patterns and price action.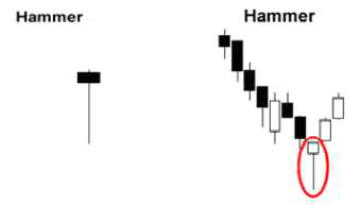


- Forex Trading Chart Patterns
- Price Actions Charts
- Fibonacci Trading
- Fibonacchi Levels Tutorials
- Trading with the Elliott Wave
- Trading with Bollinger Bands
- Trading with the MACD
- Candlestick Trading Tutorial
- Pivot Points Trading
- Trading with the RSI Indicator
- Trading with the Stochastic Indicator
- Swing Trading Strategy
- Support and Resistance Levels
- Stop Loss Tutorial


© Copyright 2016 - FX Hometrader - All rights reserved.

Candlestick Trading
Tutorial
Each candle tells a story and represents the price movement (depicting the HLOC or high, low, open and close for a specific time interval.) Each candle displays an absolute value; but also allows us to easily compare current price movement to previous price movement. Over the years many simple candle patterns and some rather complex patterns have been identified to help traders identify potential price reversals or continuations. On the following chart we are going to identify 2 simple candle formations to identify price reversals. The Hammer The above depicts a hammer candle which is identified by having a very long wick (shadow) and a very small body with little or no upper shadow (wick). This candle is normally significant when it appears after a down trend in the market and signifies a potential reversal in price. The psychology behind the candle is that the bears were in control of the market at the open of that candle indicated by the prior down trend. The bears attempted to take price even lower but the bulls intervened strongly causing the candle to close near its opening price signifying that at the close of that candle the bulls were now in control. The candle is only relevant when appearing at the bottom of a down trend. The shooting star appears at the top of an uptrend and is depicted by a candle with a long upper shadow (wick) and a short body with little or no lower wick. The candle is relevant when it appears at the top of an uptrend and signifies that the bulls were in control to that point, they tried to take price higher but the bears intervened and pushed price lower causing the candle to close near its opening price. On the following chart we can identify trading opportunities with these two candle formations. On the above chart we can see that after a significant up move price consolidated and traded in the same range for many days before breaking out short. Price stalled 5 times at the high failing to continue the uptrend. The shaded area shows the consolidation range where price failed to make any new highs or lows. During that period we had a hammer formation signifying a price reversal (Green shading) We enter the trade when price breaks above the hammer candle with our stop loss below the low of the hammer candle Entry 1.3282 stop loss 1.3248 and our take profit at the resistance top where price stalled earlier. A stop loss of 34 pips and a profit potential of almost 100 pips making it a very good risk to reward trade. The next trade was signaled by the shooting star (red shading) and once again we entered the trade when price broke below the shooting star candle with our stop loss placed above the high of the shooting star. The profit target was the low of the consolidation range at around 1.3248 a 39 pip stop loss with an 83 pip profit potential. Price then broke below the lower range of the consolidation area with a large engulfing candle confirming the end of the prior up trend and the possible start of a new down trend. To confirm the breakout from the engulfing candle price must close below the previous support line, we then wait for price to break below the low of the engulfing candle to enter a new short trade. Without using any other indicators we were able to do 3 trades using candle formations, we were also able to establish the failure of the uptrend to continue when the strong resistance structure was not breached. We were also able to identify the start of the new trend showing that price action and candle formations are capable of identifying good trading opportunities without using lagging indicators. Obviously the more cautious trader can certainly combine other indicators to confirm trades signaled by candle patterns and price action.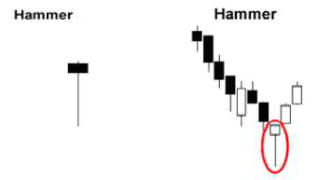


- Home
- Introduction to Forex Trading
- Trading Requirements
- Forex Trading Times
- How to Choose Your Broker
- Brokerage Firms
- About Managed Accounts
- Technical Analysis Tutorials
- Forex Trading Tutorials
- Price Action Charts
- Fibonacci Trading
- Fibonacci Levels Tutorial
- Trading with the Elliott Wave
- Trading with Bollinger Bands
- Trading with MACD
- Candlestick Trading Tutorial
- Pivot Points Trading Tutorial
- Pivot Point Calculator
- Trading with the RSI Indicator
- Trading with the Stochastic Indicator
- Swing Trading Strategy
- Stop-Loss Tutorial
- Free Trading Magazines
- Free Trading Software
- Forex Trading Books
- Forex Trading Articles
- Glossary
- About Us
- Contact Us