Fibonacci Levels Tutorial 1
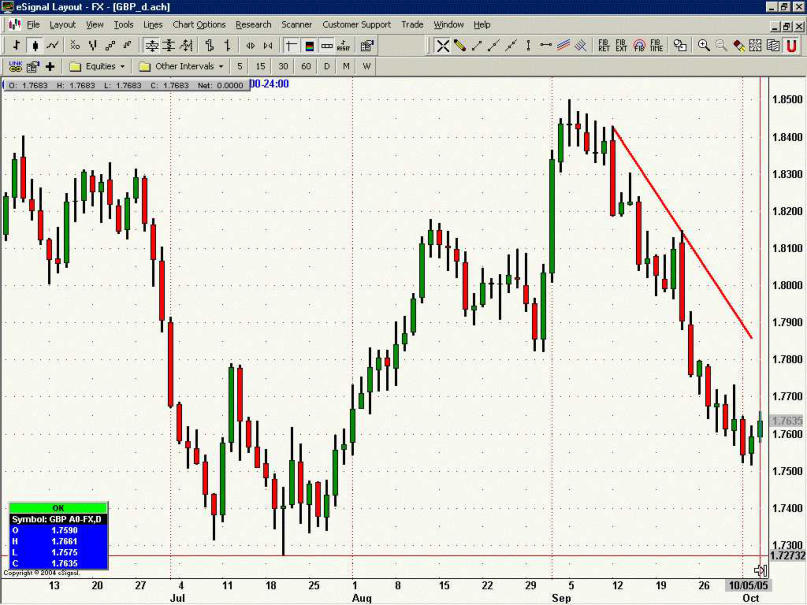
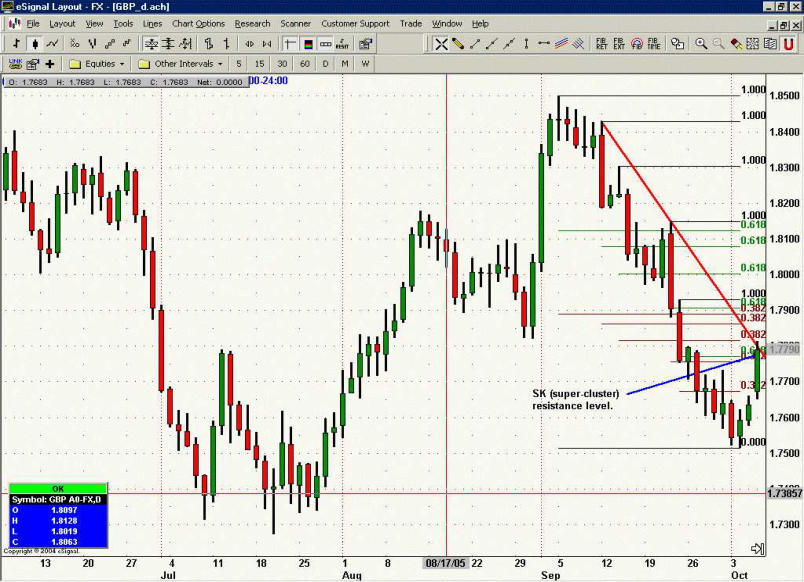
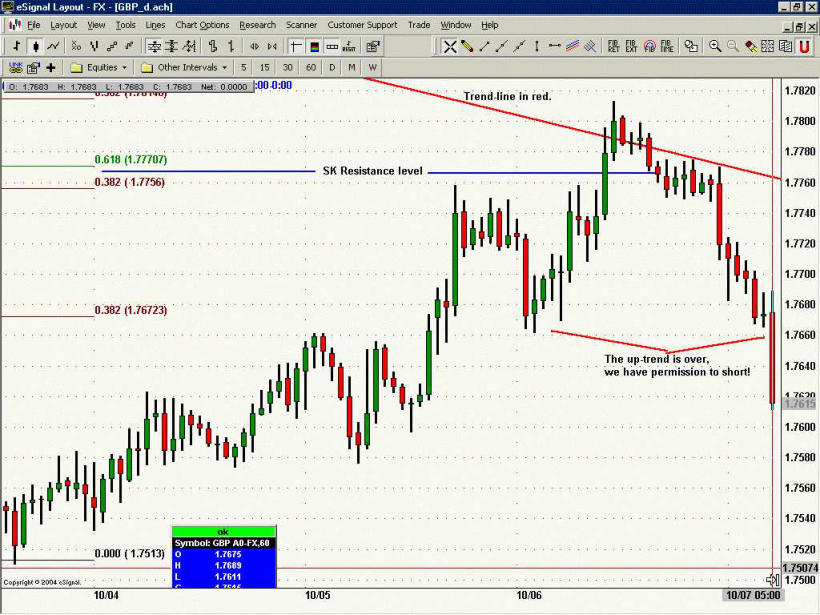
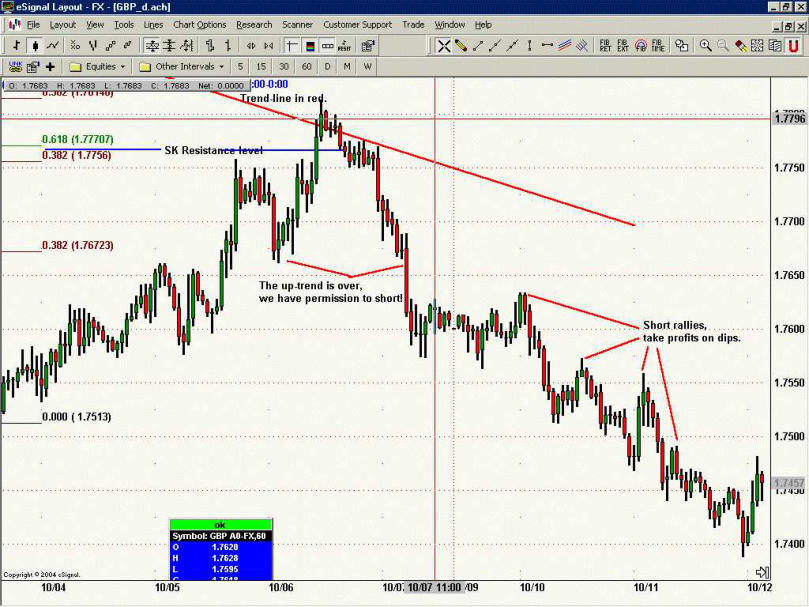
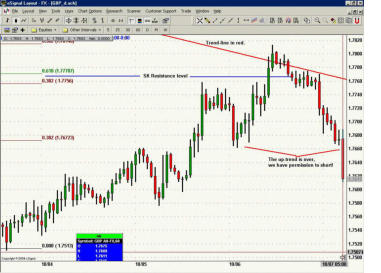
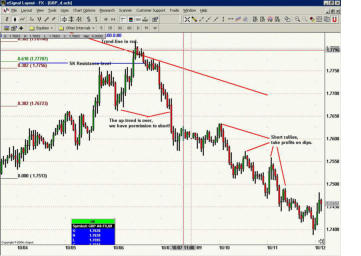
Even traders with limited experience start to realize that we are not trying to capture every market move. We want to improve our odds and reduce our frustration by filtering, for high-probability trades. The combination of trend and Fibonacci techniques can provide powerful signals for higher probability trading. We already know that trend- lines have some validity, and so do Fibonacci levels. Combine the two, to improve your chances. The following charts are the USD/British Pound GBP. First, the daily chart as of October 5th 2005. I have drawn a red down-sloping trend-line joining the two recent swing highs. CHART 1. The chart has moved down since early September, making a down-trend of consecutive "waves" with lower swing highs and lower swing lows. There were several opportunities to take advantage of the down-move. In this tutorial we will focus on the October 6th opportunity. In a down-trend we want to short those swing highs, and take profits on swing lows. We don't want to short every time we **think** we have a swing high. If you have tried that, you know about whipsaw and fake-outs already!. We only want the best trades, those which are more likely to succeed. So how do we choose an optimum entry point? Our odds are improved if we have a swing high near a down-sloping trend-line (in red on the chart). Markets tend to reverse at Fibonacci levels. So if we have a significant resistance level near a trend-line we have an even better chance of success. The next chart shows the GBP with Fibonacci resistance levels. Notice the "SK Resistance" level. This represents an area of significant resistance, with a higher probability of a reversal. If you are new to Fibonacci, those studies look like a confusing series of colored lines. Learning how to use these Fibonacci studies, and which of them are stronger (higher probability), is really easy! I have made two video seminars that explain this. CHART 2. That "SK Resistance" level, coinciding with a trend-line is an optimum shorting zone. If the market reaches that area (we can't be sure it will), and if the market resists there, we want to take a short position. Once the resistance materializes, it will be difficult for the market to move against us. Most of us are not trading the daily chart, but we can use the longer-term charts to find **powerful** trends and Fibonacci levels. The next chart is a 60-minute chart. I choose 60-minutes because it clearly shows when resistance has materialized. You may prefer a 30 minute of 5 minute chart. The following 60-minute chart shows how the Pound rallied to the SK resistance level, and the trend-line. It rallied over those, tested them briefly, then retreated. There are several ways to determine whether resistance has materialized. I have some very powerful techniques for that purpose. However we want this tutorial to focus on some basics. So for now we will use the obvious breaking of the rising trend as our trigger. CHART 3. During that rally upward, the 60-minute chart has a series of higher swing highs and higher swing lows. Once we broke the highest swing low (see the last bar on the above chart), we know that up-trend has expired. So we want to start shorting rallies and take profits on dips as shown on the next chart (60-minute chart). CHART 4. Notice how the market broke down, and never looked back. That is what happens when you combine trend-lines with Fibonacci techniques. The best trades go your way and keep on going. That is a characteristic of higher-probability trading. *This Fib Levels tutorial is kindly provided to FX HomeTrader by Neal Hughes at Fibmaster.com
© Copyright 2015 - FX Hometrader - All rights reserved.


- Forex Trading Chart Patterns
- Price Actions Charts
- Fibonacci Trading
- Fibonacchi Levels Tutorials
- Trading with the Elliott Wave
- Trading with Bollinger Bands
- Trading with the MACD
- Candlestick Trading Tutorial
- Pivot Points Trading
- Trading with the RSI Indicator
- Trading with the Stochastic Indicator
- Swing Trading Strategy
- Support and Resistance Levels
- Stop Loss Tutorial


Fibonacci Levels Tutorial
1
Even traders with limited experience start to realize that we are not trying to capture every market move. We want to improve our odds and reduce our frustration by filtering, for high-probability trades. The combination of trend and Fibonacci techniques can provide powerful signals for higher probability trading. We already know that trend-lines have some validity, and so do Fibonacci levels. Combine the two, to improve your chances. The following charts are the USD/British Pound GBP. First, the daily chart as of October 5th 2005. I have drawn a red down-sloping trend-line joining the two recent swing highs. CHART 1. The chart has moved down since early September, making a down-trend of consecutive "waves" with lower swing highs and lower swing lows. There were several opportunities to take advantage of the down-move. In this tutorial we will focus on the October 6th opportunity. In a down-trend we want to short those swing highs, and take profits on swing lows. We don't want to short every time we ”think” we have a swing high. If you have tried that, you know about whipsaw and fake-outs already!. We only want the best trades, those which are more likely to succeed. So how do we choose an optimum entry point? Our odds are improved if we have a swing high near a down-sloping trend-line (in red on the chart). Markets tend to reverse at Fibonacci levels. So if we have a significant resistance level near a trend-line we have an even better chance of success. The next chart shows the GBP with Fibonacci resistance levels. Notice the "SK Resistance" level. This represents an area of significant resistance, with a higher probability of a reversal. If you are new to Fibonacci, those studies look like a confusing series of colored lines. Learning how to use these Fibonacci studies, and which of them are stronger (higher probability), is really easy! I have made two video seminars that explain this. CHART 2. That "SK Resistance" level, coinciding with a trend-line is an optimum shorting zone. If the market reaches that area (we can't be sure it will), and if the market resists there, we want to take a short position. Once the resistance materializes, it will be difficult for the market to move against us. Most of us are not trading the daily chart, but we can use the longer-term charts to find **powerful** trends and Fibonacci levels. The next chart is a 60-minute chart. I choose 60-minutes because it clearly shows when resistance has materialized. You may prefer a 30 minute of 5 minute chart. The following 60-minute chart shows how the Pound rallied to the SK resistance level, and the trend-line. It rallied over those, tested them briefly, then retreated. There are several ways to determine whether resistance has materialized. I have some very powerful techniques for that purpose. However we want this tutorial to focus on some basics. So for now we will use the obvious breaking of the rising trend as our trigger. CHART 3. During that rally upward, the 60-minute chart has a series of higher swing highs and higher swing lows. Once we broke the highest swing low (see the last bar on the above chart), we know that up-trend has expired. So we want to start shorting rallies and take profits on dips as shown on the next chart (60-minute chart). CHART 4. Notice how the market broke down, and never looked back. That is what happens when you combine trend-lines with Fibonacci techniques. The best trades go your way and keep on going. That is a characteristic of higher-probability trading. *This Fib Levels tutorial is kindly provided to FX HomeTrader by Neal Hughes at Fibmaster.com
© Copyright 2016 - FX Hometrader - All rights reserved.


- Home
- Introduction to Forex Trading
- Trading Requirements
- Forex Trading Times
- How to Choose Your Broker
- Brokerage Firms
- About Managed Accounts
- Technical Analysis Tutorials
- Forex Trading Tutorials
- Price Action Charts
- Fibonacci Trading
- Fibonacci Levels Tutorial
- Trading with the Elliott Wave
- Trading with Bollinger Bands
- Trading with MACD
- Candlestick Trading Tutorial
- Pivot Points Trading Tutorial
- Pivot Point Calculator
- Trading with the RSI Indicator
- Trading with the Stochastic Indicator
- Swing Trading Strategy
- Stop-Loss Tutorial
- Free Trading Magazines
- Free Trading Software
- Forex Trading Books
- Forex Trading Articles
- Glossary
- About Us
- Contact Us