Forex Trading Chart Patterns
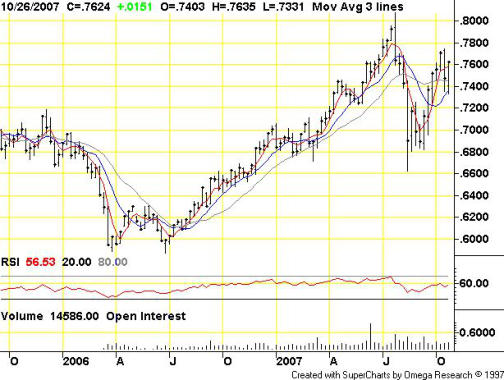
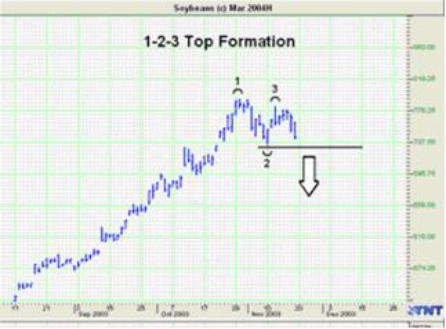
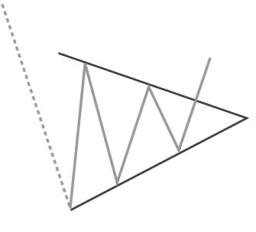
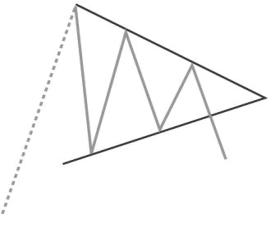
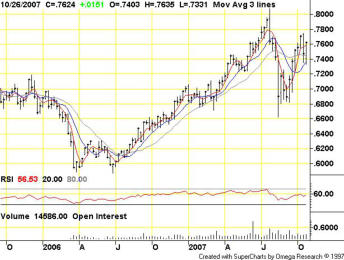
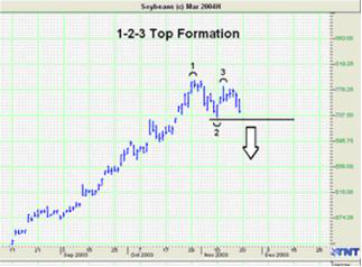
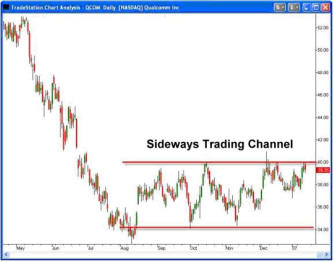
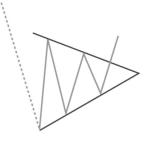
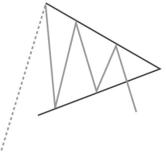
Chart patterns in Forex trading are patterns that form with price charts within a group or trading range over time. Normally when you see price charts the Y axis or the vertical line measurement is the price and the X axis or the horizontal line is the time measurement. Knowing that, prices create various formations over a period of time, that have produced successful results. This isn’t magic as price formations provide a look at what can be happening in price action. If price congests and does not break a certain price level, than the market is telling us that demand has not yet warranted a move above that price at that present time. Take a look at the following chart pattern illustrations where prices are making a bottom: As you can see by this diagram of a bar chart, you see prices reached a low point right before April of 2006 and then again right before June of the same year. The price formation that was created is called a “W-bottom”. It’s called a w-bottom because you can see that a w formation was created by price action which created the first low point right before April, and then went higher and then came back down again matching the lows in earlier set right before April. As a rule of thumb, price action would dictate a “buy” signal or a signal to go long at the piercing of the top part of the W-formation. Lining up with both the Y-axis and the X-axis we see that prices hit this peak in May of 2006 at a price right around 6300. So, if we were watching this in real time, we would then wait for the market to make its turn downward and then head towards the price at the top of that W formation at 6300. Once the price level of 6300 has been violated, it would produce a buy signal to go long. If you see after this has happen, the market proceeds to accelerate higher and price action dictates a shortage of supply along with a growing demand. As a technical analyst, you do not worry why prices is going higher in this case, just that it is. Using the W formation buy signal formation, we know that we have a probability on our side when position ourselves correctly. The next Profitable Formation is the exact opposite! Charts created by Gecko software Track n’ Trade™ It’s called the M Top or the 1-2-3 Top formation: As you can see, when the M top formation is created, it first creates a highest point on the chart. It then proceeds to make the M by coming back down at the 2 point, and then rise again to the 3 point. At this point, we would wait for the market to pierce the 2 point and then place an order to sell or short the market. Both the W-bottom and the M-Top are called Reverse Formation as the market makes a turnaround to the opposite direction when these formation are created. Of course, nothing is 100%, but the probabilities would be on your side. Our next formation is the sideways channel breakout formation. Almost 70% of the time, markets do not have a trend. This formation gives you an opportunity to profit by watching the price action as it begins to create this opportunity. Here’s the chart of a sideways channel: (Charts created by Tradestation™ software) As you can see, the market is moving sideways within a defined channel. A breakout to either the topside or the bottom side would indicate a further move once those levels are pierced. There is one caution though. There are many “fake-breakouts” and not "real" breakouts. When a market pierces either the bottom level at 34.00 or the top level at 40.00, price action needs to have at least 3 consecutive days above that level to confirm the move higher. As you can see, both on the bottom side right around Aug, and at the top side around Dec. of that same year, the market pierced both the bottom and the top. But neither held for more than 3 trading days and subsequently came right back into the sideways channel. Sideways channels are created because there may be some uncertainty as to what the supply and demand picture is. Therefore price action reflects that uncertainty with a range bound channel until either supply is too great for demand, thereby potentially providing the fuel prices to move lower than the channel; Or demand is too great, thereby potentially providing the market with fuel to move higher than the range bound channel. This moves are sometimes explosive once a direction is determined so not only are they very profitable, but they can also be very dangerous if patience isn’t properly exercised. If the market moves above the sideways channel and holds above it for 3 days, a buy signal will occur using this method. If the market moves below the sideways channel, and holds for 3 days, a sell order would occur using this method. The next profitable formation is a continuation formation and usually formed when a major trend has already been established. This formation is called a wedge formation because of how price action forms a wedge shaped formation. The basis of a wedge formation is that within a major trend, there are pullbacks where the markets takes a breath and retracts in the other direction. This retracement is a minor pullback and the overall trend is not broken. Hence it creates an opportunity for savvy investors to get into the market or even add to their holdings as the market takes a short breather before it continues on to that trend. Take a look at the trading formations below: The top diagram is a wedge with the eventual market moving higher after breaking out of the higher resistance area. The lower diagram is a diagram of a down market, with a wedge forming over several days and then continuing lower once a consolidation period occurs. In the top diagram, an order to buy would be generated with the piercing of the upper resistance level depicted by the top part of the triangle line. The bottom diagram would generate a sell signal with a prices piercing the lower support level depicted by the bottom part of the triangle line. This formation provides great entry points when you are looking to get into a market with a favorable position. Read more on Price Action Charts.
© Copyright 2015 - FX Hometrader - All rights reserved.


- Forex Trading Chart Patterns
- Price Actions Charts
- Fibonacci Trading
- Fibonacchi Levels Tutorials
- Trading with the Elliott Wave
- Trading with Bollinger Bands
- Trading with the MACD
- Candlestick Trading Tutorial
- Pivot Points Trading
- Trading with the RSI Indicator
- Trading with the Stochastic Indicator
- Swing Trading Strategy
- Support and Resistance Levels
- Stop Loss Tutorial


Forex Trading Chart
Patterns
Chart patterns in Forex trading are patterns that form with price charts within a group or trading range over time. Normally when you see price charts the Y axis or the vertical line measurement is the price and the X axis or the horizontal line is the time measurement. Knowing that, prices create various formations over a period of time, that have produced successful results. This isn’t magic as price formations provide a look at what can be happening in price action. If price congests and does not break a certain price level, than the market is telling us that demand has not yet warranted a move above that price at that present time. Take a look at the following chart pattern illustrations where prices are making a bottom: As you can see by this diagram of a bar chart, you see prices reached a low point right before April of 2006 and then again right before June of the same year. The price formation that was created is called a “W-bottom”. It’s called a w-bottom because you can see that a w formation was created by price action which created the first low point right before April, and then went higher and then came back down again matching the lows in earlier set right before April. As a rule of thumb, price action would dictate a “buy” signal or a signal to go long at the piercing of the top part of the W- formation. Lining up with both the Y-axis and the X-axis we see that prices hit this peak in May of 2006 at a price right around 6300. So, if we were watching this in real time, we would then wait for the market to make its turn downward and then head towards the price at the top of that W formation at 6300. Once the price level of 6300 has been violated, it would produce a buy signal to go long. If you see after this has happen, the market proceeds to accelerate higher and price action dictates a shortage of supply along with a growing demand. As a technical analyst, you do not worry why prices is going higher in this case, just that it is. Using the W formation buy signal formation, we know that we have a probability on our side when position ourselves correctly. The next Profitable Formation is the exact opposite! Charts created by Gecko software Track n’ Trade™ It’s called the M Top or the 1-2-3 Top formation: As you can see, when the M top formation is created, it first creates a highest point on the chart. It then proceeds to make the M by coming back down at the 2 point, and then rise again to the 3 point. At this point, we would wait for the market to pierce the 2 point and then place an order to sell or short the market. Both the W-bottom and the M-Top are called Reverse Formation as the market makes a turnaround to the opposite direction when these formation are created. Of course, nothing is 100%, but the probabilities would be on your side. Our next formation is the sideways channel breakout formation. Almost 70% of the time, markets do not have a trend. This formation gives you an opportunity to profit by watching the price action as it begins to create this opportunity. Here’s the chart of a sideways channel: Charts created by Tradestation™ software) As you can see, the market is moving sideways within a defined channel. A breakout to either the topside or the bottom side would indicate a further move once those levels are pierced. There is one caution though. There are many “fake-breakouts” and not "real" breakouts. When a market pierces either the bottom level at 34.00 or the top level at 40.00, price action needs to have at least 3 consecutive days above that level to confirm the move higher. As you can see, both on the bottom side right around Aug, and at the top side around Dec. of that same year, the market pierced both the bottom and the top. But neither held for more than 3 trading days and subsequently came right back into the sideways channel. Sideways channels are created because there may be some uncertainty as to what the supply and demand picture is. Therefore price action reflects that uncertainty with a range bound channel until either supply is too great for demand, thereby potentially providing the fuel prices to move lower than the channel; Or demand is too great, thereby potentially providing the market with fuel to move higher than the range bound channel. This moves are sometimes explosive once a direction is determined so not only are they very profitable, but they can also be very dangerous if patience isn’t properly exercised. If the market moves above the sideways channel and holds above it for 3 days, a buy signal will occur using this method. If the market moves below the sideways channel, and holds for 3 days, a sell order would occur using this method. The next profitable formation is a continuation formation and usually formed when a major trend has already been established. This formation is called a wedge formation because of how price action forms a wedge shaped formation. The basis of a wedge formation is that within a major trend, there are pullbacks where the markets takes a breath and retracts in the other direction. This retracement is a minor pullback and the overall trend is not broken. Hence it creates an opportunity for savvy investors to get into the market or even add to their holdings as the market takes a short breather before it continues on to that trend. Take a look at the trading formations below: The top diagram is a wedge with the eventual market moving higher after breaking out of the higher resistance area. The lower diagram is a diagram of a down market, with a wedge forming over several days and then continuing lower once a consolidation period occurs. In the top diagram, an order to buy would be generated with the piercing of the upper resistance level depicted by the top part of the triangle line. The bottom diagram would generate a sell signal with a prices piercing the lower support level depicted by the bottom part of the triangle line. This formation provides great entry points when you are looking to get into a market with a favorable position. Read more on Price Action Charts.
© Copyright 2016 - FX Hometrader - All rights reserved.


- Home
- Introduction to Forex Trading
- Trading Requirements
- Forex Trading Times
- How to Choose Your Broker
- Brokerage Firms
- About Managed Accounts
- Technical Analysis Tutorials
- Forex Trading Tutorials
- Price Action Charts
- Fibonacci Trading
- Fibonacci Levels Tutorial
- Trading with the Elliott Wave
- Trading with Bollinger Bands
- Trading with MACD
- Candlestick Trading Tutorial
- Pivot Points Trading Tutorial
- Pivot Point Calculator
- Trading with the RSI Indicator
- Trading with the Stochastic Indicator
- Swing Trading Strategy
- Stop-Loss Tutorial
- Free Trading Magazines
- Free Trading Software
- Forex Trading Books
- Forex Trading Articles
- Glossary
- About Us
- Contact Us