
© Copyright 2015 - FX Hometrader - All rights reserved.

Trading with the MACD
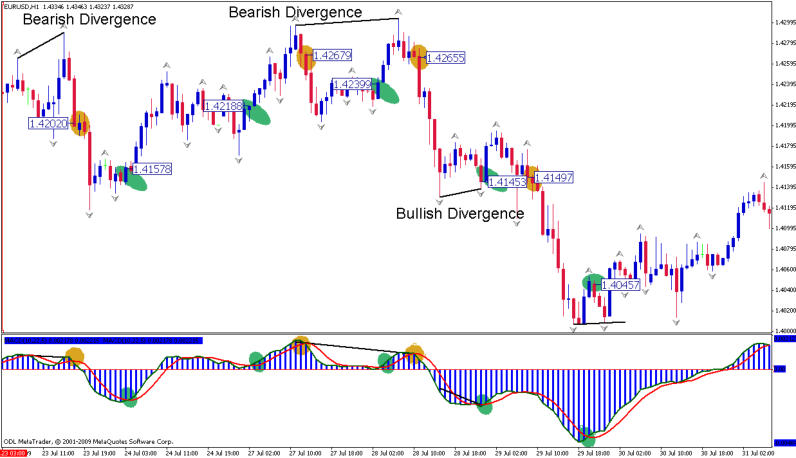
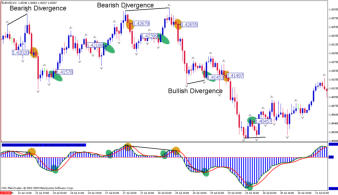
Moving average convergence divergence (MACD) is a popular technical trading indicator used by traders the world over was invented by George Appel in the late 1970’s and can be used as either a trend or momentum indicator. This indicator calculates the differences between the closing prices of an instruments 12 and 26 period exponential moving averages. The 12 period ema is the faster; and the 26 period ema the slower. A 9 period exponential moving average of the MACD itself is also plotted and represented as a histogram in the indicator window and also serves as our trigger to enter or exit the market. The MACD signals a buy when it crosses above it own 9 period exponential moving average; and a sell signal when it crosses below its 9 period EMA. The histogram is positive when it crosses above its nine period ema and negative when it crosses below it 9 period ema. When price is rising the histogram bars grow longer as price momentum increases accelerates and they contract when momentum slows. The same principal works in reverse as price drops. The MACD is also a useful tool for identifying divergence which occurs when price is going in one direction but the indicator is going in the opposite direction. We enter a trade long when the histogram bar crosses above its 9 period moving average: short when the histogram bar crosses below its 9 period moving average as can be seen on the following chart. On this chart we can identify a number of trades where the green shaded areas represent the buy opportunities and the gold shaded area the sell opportunities. When the histogram bars open above the zero line this is a good indication that the market is confirming or entering a new uptrend. When the histogram opens below the zero line this is often a good indication that the market is entering a new bearish trend. As we can see from the above chart all but one of the trades were good with two very profitable trades. We can also see that two of the short trades were preceded by bearish divergence where we could have used the divergence to enter the market sooner than waiting for the cross. The one bullish divergence failed and resulted in a loss, but in fairness occurred during a very quiet period in the market when we probably would not have made a trading decision. The 12, 26, 9 MACD settings used on this chart are the standard settings for the MACD; but like most indicators the sensitivity of the indicator can be changed to suit different time frames and instruments. If we look at the next chart you can see I have changed the settings to 10, 22, and 5. Most of the trades had better entry points than with the standard settings. The more sensitive settings can lead to more false signals though. So it is always a toss up between earlier entries and fake outs. As there are very few “one size fits all” indicators we need to test various settings on the different time frames until we find one that offers a good balance between entry and false signals for our preferred time frame and currency.


- Forex Trading Chart Patterns
- Price Actions Charts
- Fibonacci Trading
- Fibonacchi Levels Tutorials
- Trading with the Elliott Wave
- Trading with Bollinger Bands
- Trading with the MACD
- Candlestick Trading Tutorial
- Pivot Points Trading
- Trading with the RSI Indicator
- Trading with the Stochastic Indicator
- Swing Trading Strategy
- Support and Resistance Levels
- Stop Loss Tutorial


© Copyright 2016 - FX Hometrader - All rights reserved.

Trading with the MACD
Moving average convergence divergence (MACD) a popular technical trading indicator used by traders the world over was invented by George Appel in the late 1970’s and can be used as either a trend or momentum indicator. This indicator calculates the differences between the closing prices of an instruments 12 and 26 period exponential moving averages. The 12 period ema is the faster; and the 26 period ema the slower. A 9 period exponential moving average of the MACD itself is also plotted and represented as a histogram in the indicator window and also serves as our trigger to enter or exit the market. The MACD signals a buy when it crosses above it own 9 period exponential moving average; and a sell signal when it crosses below its 9 period EMA. The histogram is positive when it crosses above its nine period ema and negative when it crosses below it 9 period ema. When price is rising the histogram bars grow longer as price momentum increases accelerates and they contract when momentum slows. The same principal works in reverse as price drops. The MACD is also a useful tool for identifying divergence which occurs when price is going in one direction but the indicator is going in the opposite direction. We enter a trade long when the histogram bar crosses above its 9 period moving average: short when the histogram bar crosses below its 9 period moving average as can be seen on the following chart. On this chart we can identify a number of trades where the green shaded areas represent the buy opportunities and the gold shaded area the sell opportunities. When the histogram bars open above the zero line this is a good indication that the market is confirming or entering a new uptrend. When the histogram opens below the zero line this is often a good indication that the market is entering a new bearish trend. As we can see from the above chart all but one of the trades were good with two very profitable trades. We can also see that two of the short trades were preceded by bearish divergence where we could have used the divergence to enter the market sooner than waiting for the cross. The one bullish divergence failed and resulted in a loss, but in fairness occurred during a very quiet period in the market when we probably would not have made a trading decision. The 12, 26, 9 MACD settings used on this chart are the standard settings for the MACD; but like most indicators the sensitivity of the indicator can be changed to suit different time frames and instruments. If we look at the next chart you can see I have changed the settings to 10, 22, and 5. Most of the trades had better entry points than with the standard settings. The more sensitive settings can lead to more false signals though. So it is always a toss up between earlier entries and fake outs. As there are very few “one size fits all” indicators we need to test various settings on the different time frames until we find one that offers a good balance between entry and false signals for our preferred time frame and currency.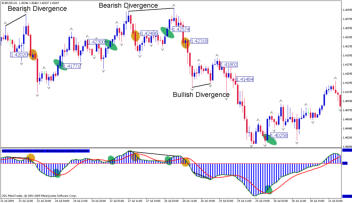


- Home
- Introduction to Forex Trading
- Trading Requirements
- Forex Trading Times
- How to Choose Your Broker
- Brokerage Firms
- About Managed Accounts
- Technical Analysis Tutorials
- Forex Trading Tutorials
- Price Action Charts
- Fibonacci Trading
- Fibonacci Levels Tutorial
- Trading with the Elliott Wave
- Trading with Bollinger Bands
- Trading with MACD
- Candlestick Trading Tutorial
- Pivot Points Trading Tutorial
- Pivot Point Calculator
- Trading with the RSI Indicator
- Trading with the Stochastic Indicator
- Swing Trading Strategy
- Stop-Loss Tutorial
- Free Trading Magazines
- Free Trading Software
- Forex Trading Books
- Forex Trading Articles
- Glossary
- About Us
- Contact Us