
© Copyright 2015 - FX Hometrader - All rights reserved.

Pivot Points Trading Tutorial
Learn How to Use Pivot Points in Forex Trading
A pivot is generally an area where due to market congestion price is likely to turn and go in the opposite direction. Pivot points are calculated by adding the previous day, high price, low price and closing price then dividing the result by three. Using Pivot points in day trading are popular because they are predictive rather than lagging, providing a trader with 7 possible turning points each day. (Pivot, 3 support, 3 resistance.) With modern day trading methods many tools are available to automatically update your daily pivot points without the tedious job of having to calculate new Pivot Points daily. We assume that if the price opens below the daily Pivot Point then the bias for the day is short, if price opens above the Pivot Point then the bias for the day is long. (This concept is only valid until the Pivot Point has been breached, at which point price can reverse.) NB: The Pivot Point can provide the trader with three vital ingredients, namely an entry point, a stop loss, and a profit target. As the points are calculated on the previous day’s movement we can apply them to any trading time frame without altering the points as would happen with other indicators. The three important points most traders concentrate on are the actual pivot point, the R1 (resistance 1) and S1 (support 1) Generally by the time price gets to the S2, S3 or R2, R3 points then the market could be overbought or oversold so these points are used to exit trades rather than enter new positions.Break Out and Reversal trades.
For the 1st example we have used the 3rd of April 2012 daily movement to look for trades on the 4th of April. As we can see on the 15 min EUR/USD chart, the price opened well below the PP at 1.3300 and stalled at the S1 price forming a small channel. The Bias at this point was clearly short. Note: Here we had 2 possible entry methods to short the market at this point. 1. We could enter short below the S1 area with our stop loss above the previous high or channel high. Our 1st target will be the Support 2 line where we can close half of our position and move our stop loss to Break even and target S3 to close the remainder of the trade. If we had entered at the break of the S1 line our entry price was 1.3231 and our stop loss at 1.3243 (12 pips + spread). For the more conservative trader we could have waited for the channel breakout at 1.3215 using the same stop loss at 1.3243 (30 pips stop loss.) The risk to reward ratio on both trades is greater than 2:1 making it a worthwhile trade. The vertical lines represent the day’s open and closing points. The trade worked out well and eventually achieved the second target the following day. Based on the chart above we have looked at 2 useful methods to trade the Pivot points, the breakout where price broke below the channel and the pull back where price broke below the S1 pulled back to the S1 then failed and continued down to the S2.Trading Pivot Points with a standard MACD
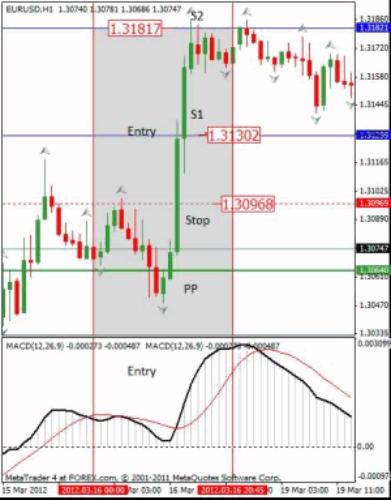
As with most other trading systems we can use other indicators to confirm pivot point entries. On the following chart the shaded area is for the trading day 16th March using the March 15th data to calculate the Pivot Points. Price opened above the PP signifying a long bias for the day. Price failed at the PP – R1 midpoint and broke below the PP but failed to continue to the S1. I have added a standard MACD indicator that crosses to confirm the long trade from R1 to R2 with the stop below the PP – S1 midpoint and take profit at the R2 line where price hit our target and retraced. Once again we had a good risk to reward with a 34 pip stop loss and a 50 pip profit potential. By adding the MACD indicator we were able to confirm our entry at the Break of the R1. The MACD also clearly showed the market was already in an uptrend with the entire day’s movement above the MACD zero line. For more in-dept information visit Professional trader and author Peter Bain's Video Forex Course demonstrates simple yet powerful pivot currency trading systems used by professional traders.


- Forex Trading Chart Patterns
- Price Actions Charts
- Fibonacci Trading
- Fibonacchi Levels Tutorials
- Trading with the Elliott Wave
- Trading with Bollinger Bands
- Trading with the MACD
- Candlestick Trading Tutorial
- Pivot Points Trading
- Trading with the RSI Indicator
- Trading with the Stochastic Indicator
- Swing Trading Strategy
- Support and Resistance Levels
- Stop Loss Tutorial


© Copyright 2016 - FX Hometrader - All rights reserved.

Pivot Points Trading
Tutorial
Learn How to Use Pivot Points
in Forex Trading
A pivot is generally an area where due to market congestion price is likely to turn and go in the opposite direction. Pivot points are calculated by adding the previous day, high price, low price and closing price then dividing the result by three. Using Pivot points in day trading are popular because they are predictive rather than lagging, providing a trader with 7 possible turning points each day. (Pivot, 3 support, 3 resistance.) With modern day trading methods many tools are available to automatically update your daily pivot points without the tedious job of having to calculate new Pivot Points daily. We assume that if the price opens below the daily Pivot Point then the bias for the day is short, if price opens above the Pivot Point then the bias for the day is long. (This concept is only valid until the Pivot Point has been breached, at which point price can reverse.) NB: The Pivot Point can provide the trader with three vital ingredients, namely an entry point, a stop loss, and a profit target. As the points are calculated on the previous day’s movement we can apply them to any trading time frame without altering the points as would happen with other indicators. The three important points most traders concentrate on are the actual pivot point, the R1 (resistance 1) and S1 (support 1) Generally by the time price gets to the S2, S3 or R2, R3 points then the market could be overbought or oversold so these points are used to exit trades rather than enter new positions.Break Out and Reversal trades.
For the 1st example we have used the 3rd of April 2012 daily movement to look for trades on the 4th of April. As we can see on the 15 min EUR/USD chart, the price opened well below the PP at 1.3300 and stalled at the S1 price forming a small channel. The Bias at this point was clearly short. Note: Here we had 2 possible entry methods to short the market at this point. 1. We could enter short below the S1 area with our stop loss above the previous high or channel high. Our 1st target will be the Support 2 line where we can close half of our position and move our stop loss to Break even and target S3 to close the remainder of the trade. If we had entered at the break of the S1 line our entry price was 1.3231 and our stop loss at 1.3243 (12 pips + spread). For the more conservative trader we could have waited for the channel breakout at 1.3215 using the same stop loss at 1.3243 (30 pips stop loss.) The risk to reward ratio on both trades is greater than 2:1 making it a worthwhile trade. The vertical lines represent the day’s open and closing points. The trade worked out well and eventually achieved the second target the following day. Based on the chart above we have looked at 2 useful methods to trade the Pivot points, the breakout where price broke below the channel and the pull back where price broke below the S1 pulled back to the S1 then failed and continued down to the S2.Trading Pivot Points with a standard
MACD
As with most other trading systems we can use other indicators to confirm pivot point entries. On the following chart the shaded area is for the trading day 16th March using the March 15th data to calculate the Pivot Points.


- Home
- Introduction to Forex Trading
- Trading Requirements
- Forex Trading Times
- How to Choose Your Broker
- Brokerage Firms
- About Managed Accounts
- Technical Analysis Tutorials
- Forex Trading Tutorials
- Price Action Charts
- Fibonacci Trading
- Fibonacci Levels Tutorial
- Trading with the Elliott Wave
- Trading with Bollinger Bands
- Trading with MACD
- Candlestick Trading Tutorial
- Pivot Points Trading Tutorial
- Pivot Point Calculator
- Trading with the RSI Indicator
- Trading with the Stochastic Indicator
- Swing Trading Strategy
- Stop-Loss Tutorial
- Free Trading Magazines
- Free Trading Software
- Forex Trading Books
- Forex Trading Articles
- Glossary
- About Us
- Contact Us