Price Action Charts in Forex Trading
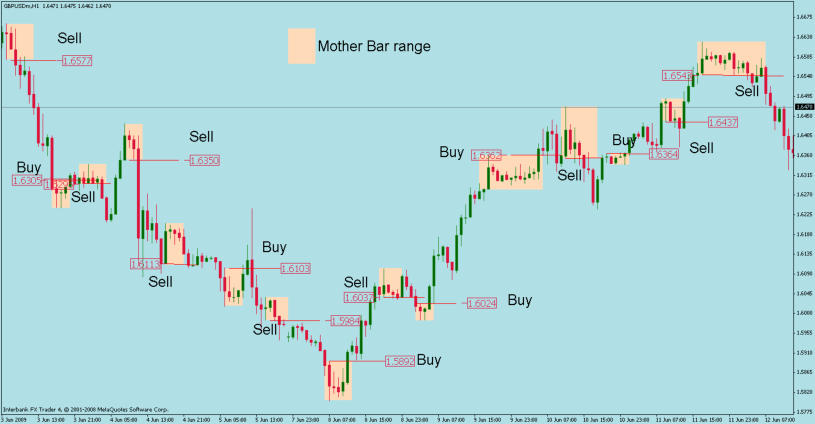
Many traders use price action charts as opposed to indicators to make their trading decisions. Most indicators are based on past price movement and therefore lag the market resulting in a late entry; or missing a large part of the move. Price action on the other hand interprets current price to determine if there is a trade setup. One of the more popular methods of interpreting price action is to examine the current bar or candle stick patterns or formations. When the market has been trending in a direction often an inside bar is formed indicating indecision in the market. When the inside bar is formed this could be and indication of a reversal or continuation in the trend. For the purpose of this price action chart tutorial we will Label the bar preceding the inside bar as the Mother bar. The bar that breaks the support or resistance of the mother bar we will label the trigger Bar. If we look at the above GBP/USD 1 Hr chart we can see that numerous potential trades have been identified by the formation of an inside bar. The high of the Mother bar is the resistance and the low is the support. When a candle or bar breaks the support or resistance of the mother bar we enter the trade in the direction of the break. If price breaks resistance we enter long; if price breaks the support of the mother bar we enter short. If the break is preceded by a pin bar then the trade has a far better chance of success. A pin bar is any bar that has a long shadow or wick; or with bar charts the open and close of the bar is close together but a long way from the high or low of the bar. If the shadow or wick is pointing up then we would consider this a signal to enter short if the pin bar precedes the break. If the shadow or wick is pointing down we would consider this a possible signal to enter long provided it precedes the breakout. The entry point for the trade would be the break of support or resistance of the mother bar. The stop loss will be placed above the low of the entry bar in a long trade and above the high of the entry bar on a short trade. The profit target would be at least two to three times the risk. Many traders will use the high or low of the mother bar as the stop loss point. Even if this method of trading only produces a fifty/ fifty result the tight stops and high risk to reward ratio generally makes it a very profitable trading method. As we can see from the attached chart we had very few failures and most of the trades produced a three to one risk to reward profit ratio. Only one of the trades was preceded by pin bars though. This pattern is very common on the 1hr charts and can also be traded on the four hour and daily charts. If we look at the first trade on the left of the chart the mother bars range is coloured pink; followed by an inside bar. The following red bar broke through the lower range (support) of the mother bar giving us our sell entry for the trade at 1.6577. Our stop was above our entry bar at 1.6660 a stop loss of 83 pips. *Our target of three times risk was at 1.65316 was reached prior to the market bottoming out.
© Copyright 2015 - FX Hometrader - All rights reserved.


- Forex Trading Chart Patterns
- Price Actions Charts
- Fibonacci Trading
- Fibonacchi Levels Tutorials
- Trading with the Elliott Wave
- Trading with Bollinger Bands
- Trading with the MACD
- Candlestick Trading Tutorial
- Pivot Points Trading
- Trading with the RSI Indicator
- Trading with the Stochastic Indicator
- Swing Trading Strategy
- Support and Resistance Levels
- Stop Loss Tutorial


Price Action Charts in
Forex Trading
Many traders use price action charts as opposed to indicators to make their trading decisions. Most indicators are based on past price movement and therefore lag the market resulting in a late entry; or missing a large part of the move. Price action on the other hand interprets current price to determine if there is a trade setup. One of the more popular methods of interpreting price action is to examine the current bar or candle stick patterns or formations. When the market has been trending in a direction often an inside bar is formed indicating indecision in the market. When the inside bar is formed this could be and indication of a reversal or continuation in the trend. For the purpose of this price action chart tutorial we will Label the bar preceding the inside bar as the Mother bar. The bar that breaks the support or resistance of the mother bar we will label the trigger Bar. If we look at the above GBP/USD 1 Hr chart we can see that numerous potential trades have been identified by the formation of an inside bar. The high of the Mother bar is the resistance and the low is the support. When a candle or bar breaks the support or resistance of the mother bar we enter the trade in the direction of the break. If price breaks resistance we enter long; if price breaks the support of the mother bar we enter short. If the break is preceded by a pin bar then the trade has a far better chance of success. A pin bar is any bar that has a long shadow or wick; or with bar charts the open and close of the bar is close together but a long way from the high or low of the bar. If the shadow or wick is pointing up then we would consider this a signal to enter short if the pin bar precedes the break. If the shadow or wick is pointing down we would consider this a possible signal to enter long provided it precedes the breakout. The entry point for the trade would be the break of support or resistance of the mother bar. The stop loss will be placed above the low of the entry bar in a long trade and above the high of the entry bar on a short trade. The profit target would be at least two to three times the risk. Many traders will use the high or low of the mother bar as the stop loss point. Even if this method of trading only produces a fifty/ fifty result the tight stops and high risk to reward ratio generally makes it a very profitable trading method. As we can see from the attached chart we had very few failures and most of the trades produced a three to one risk to reward profit ratio. Only one of the trades was preceded by pin bars though. This pattern is very common on the 1hr charts and can also be traded on the four hour and daily charts. If we look at the first trade on the left of the chart the mother bars range is coloured pink; followed by an inside bar. The following red bar broke through the lower range (support) of the mother bar giving us our sell entry for the trade at 1.6577. Our stop was above our entry bar at 1.6660 a stop loss of 83 pips. *Our target of three times risk was at 1.65316 was reached prior to the market bottoming out.
© Copyright 2016 - FX Hometrader - All rights reserved.


- Home
- Introduction to Forex Trading
- Trading Requirements
- Forex Trading Times
- How to Choose Your Broker
- Brokerage Firms
- About Managed Accounts
- Technical Analysis Tutorials
- Forex Trading Tutorials
- Price Action Charts
- Fibonacci Trading
- Fibonacci Levels Tutorial
- Trading with the Elliott Wave
- Trading with Bollinger Bands
- Trading with MACD
- Candlestick Trading Tutorial
- Pivot Points Trading Tutorial
- Pivot Point Calculator
- Trading with the RSI Indicator
- Trading with the Stochastic Indicator
- Swing Trading Strategy
- Stop-Loss Tutorial
- Free Trading Magazines
- Free Trading Software
- Forex Trading Books
- Forex Trading Articles
- Glossary
- About Us
- Contact Us