© Copyright 2015 - FX Hometrader - All rights reserved.

Identify Support and Resistance Levels
How to identify significant levels of Support and Resistance and to draw in Long-term trend lines to identify market direction. Here you will
find a short tutorial on how to identify market direction in Forex trading before entering into a live trade.
Step 1: Steps to follow when starting your analysis.
Choose your preferred currency pair and open up the Daily Candlestick chart. Even though you will not be trading on the daily, you need to
be aware of the overall trend as well as any significant Support/Resistant levels.
Compress your daily chart by 1 click. This will enable you to see the “Weekly” trend and get a much bigger perception of the market
movement over the longer term. This need only be done once a week. Once this is done, release the graph to the normal view.
Identify the significant support/resistant levels and take note of them on your trading plan.
Using the 5 candle high/low formations, only identify the levels within 100 pips above and below the current market price. Why only 100
pips? Although it is not uncommon for the market to move 100 pips + per day, levels further than this are negligible.
Put in the medium (inner) and long term (outer) trend lines to identify and “out-line” the current BULL or BEAR market perception. Keep in
mind that this medium term (inner) trend line will actually signify a Long-Term trend on most of your shorter time frame graphs.
Again, all you should be interested in, with this daily chart, is to identify and out-line the general market direction, either bullish or bearish
and which price levels (support/resistance) could halt the market.
Step 2: Change down to your 4-hourly graph.
Objectives: To identify significant levels of Support and Resistance and to draw in Medium-term trend lines to identify market direction.
Now you will begin to “zoom in” to the current market action. Still, you will not be looking for a trade at this point but merely attempting to
gain a bias towards who is dominating the current market, the BULLS or the BEARS.
Working from the trend lines that you drew on your daily, add in the new “shorter-term” trend lines that the market is reacting to now!
Add in significant support/resistance levels. Only add in 1 or 2 more levels to keep your chart clear of too many lines. If you identify ALL the
possible levels of support/resistance, you will be too scared to trade. Try to focus on the significant ones only (the levels that have been
touched or approached several times).
Now summarize the market conditions by asking yourself the following questions:
What was the overall, long-term trend of the market? (Get this from your daily analysis). What is the current 4-hour trend of the market?
(Get this from your most recent trend-line direction). Is the market reaching a significant price support/resistance level that could cause this
market to halt or reverse?
How significant is this level? (How many times has it been touched/ approached?)
Is the market reaching a significant trend line which it could bounce off of? (Significance relates to how long, time-wise, the trend has been
running for).
If you were to trade in the direction of the current 4-hour trend, would there be enough “space” for me to capture a worth while profit? (i.e.
Are there any support/ resistance levels or trend lines in the way of the market direction?)
Step 3: Change down to your 1-hourly graph.
Objective:To identify significant levels of Support and Resistance and to draw in SHORT-term trend lines to identify market direction. Again
you are zooming further into the market price movement. This is an affordable time frame where you will begin to identify potential trades.
Follow the same steps as above:
Add in shorter-term trend-lines that the market is reacting to now. Add in new support/ resistance price levels that the market might react
to. By now, you will agree that you have MANY support and resistance levels to take into consideration.
I suggest that you change the color (or thickness) of these lines and group them, by color/thickness, in order of significance. After repeating
this process several times, you will no longer need to do this but this is an excellent learning tool.
Again, summarize the current market conditions using the above stated questions. Write down each of your answers so that you have
reference points, were a trade to appear. Depending on your answers to these questions, you will have one of 2 scenarios:
Scenario 1: The market has a clear trend in the direction of the 4-hour graph, with only minor, or no price levels or trend lines in its way
that would hamper you reaching your profit objective.
Scenario 2: The market is at or near a potential level of “conflict”. In this instance, you will have to sit back and allow the market to stabilize,
and let the bulls or bears confirm a trend direction that is favorable to you. Using your price levels and trend lines as trigger points will help
you to identify whether or not market conditions are favorable to trade.
Note: If you have limited equity to put down as risk, or just prefer to have tighter stops in general, you can zoom in further to the 30 minute
chart and by following the same steps as above, find a potential trade. The more often you do your analysis, the easier it will become to
identify good trading scenarios. You will become able to easily identify support/ resistance levels as well as trend lines. You will also begin
to recognize each currency pair’s particular characteristics and take advantage of them.
Before you even begin to THINK about placing a trade, you should focus on your trend analysis skills. Anyone can trade, but the successful
traders take time to identify good trading conditions. A good market analysis will get you to this point.
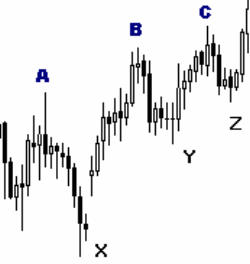
Rules to finding support or resistance.
To identify levels of resistance, look for the 5-candle high formation. Keep in mind that these points should be surrounded by “space”, they
should stick out! Remember to only “STEP-UP” from the current market price. Refer to points A, B and C in the diagram below.
To identify levels of support, look for the 5-candle low formation and the “space” around the low. Remember to only ‘STEP-DOWN” from the
current market price. Refer to points X, Y and Z.
Now you good to go!
Trade set-up and placement
Once you have done your FULL analysis and have a BULL or BEAR opinion of the market, you will be looking to place a trade should one
come up. Always remember “The trend is your friend.”
Never trade against the trend. Stay with the winning team. If your analysis leaves you confused or undecided as to which team is winning,
don’t trade. The market could be range bound and moving sideways.
“When in doubt, STAY OUT!”
As mentioned on the previous page, trade identification can be done on a 30 minute or 1 hourly graph. Any time frame longer than 1 hour
will require large stop losses. As a novice trader, your short to medium term goal is SURVIVAL, so you should be risking as small a
percentage or your margin account as possible. According to your equity management plan discussed during the course, you will be
looking to risk no more than 10% of your margin account per trade. Quantify how much money you are willing to loose, BEFORE you begin
to look for a trade.
The potential loss (pips at risk) is the only thing you can control 100% when you trade.
Create a trading check list which you feel comfortable with, that contains a set of rules and criteria that must be met before you enter any
given trade. Either the market will conform to YOUR criteria, or you will not trade.
Step 1: Identify the most recent A-B price swing.
Objective: Once the A-B price swing is identified, you will have your start and end point to draw the Fibonacci lines, with the retracement
levels and their related extensions.
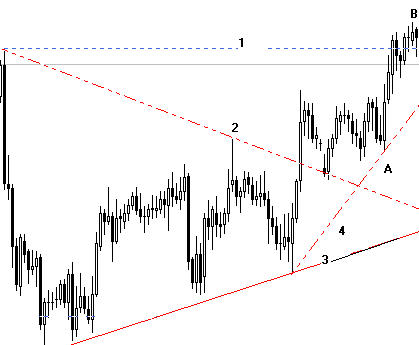
Start at the point, on your most recent current short-term trend line, where the price most recently bounced off from. In the diagram
below, refer to point 4. This is the current short-term trend-line. Follow the price movement from this point. This must be in the direction of
the current trend.
Can you see if the market is beginning to retrace after its initial thrust in the trend’s direction?( Refer to point B ) This means that the A-B
has formed and now the market is looking for a price (at a Fibonacci C level), to bounce off of.
When the A-B price swing is identified, in the direction of the current trend, it’s a signal that the winning team is advancing to “score
another point”. Refer to point 1, the market has taken out this level of resistance, at B, and the current probability is for the market to
retrace back down to the current short-term trend-line and bounce.
Diagram 1
At this point in time, once the A-B price swing has been identified, place your Fibonacci on the A-B price. Refer to the diagram below. In
trading, the best tool to have to aid us in making our decision to trade or not is “Convergence” of probabilities.
As seen above, the probability is for the market to pull-back (after scoring a point) and probably bounce on the trend line. Once we have
the A-B to draw a Fibonacci, the proven probability is that the market will bounce at a Fib-level. Can you now see what is meant when a
Convergence of Probability exists. When all these factors meet (converge) at a price point, there is an excellent probability of a successful
trade.
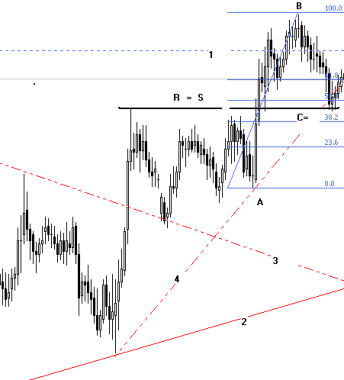
Diagram 2.
As you can see above, the Bulls have scored a point by breaking resistance at point 1 and the higher probability is for the market to pull-
back and bounce off the current bull trend-line. A second probability exists where the market will most likely bounce at a previous level of
Resistance becoming Support (refer to level R=S). As you can see at point C, the market also converges at a 0.618 Fib level (0.382). This too
is considered to be a hidden level of Support. Finally, at point C exists a Morning Star candle formation. This indicates a Bull movement.
Let’s summarize what has been covered so far with the above trade:
At point B, the market scored by breaking resistance, shown by point 1. Probability 1: Pull back to the short-term trend line. Immediately
draw in your Fib levels once the high of B is identified.
Market pulls back to point C, slightly breaking the trend line but stops at a 0.618 Fib level. Probability 2: Market should bounce off this
“hidden” level of Support.
At point C, the market also encounters a Support level identified by a previous Resistance (R=S). Probability 3: Market should bounce off
this level and go North.
At point C, the market exhibits a BULL candle formation in the form of a Morning Star. Probability 4: The market should move bullish.
And there you have it, 4 probabilities that the market should move in the BULL’s favor. So these are the steps to get in. What next? Stop
loss? Limit order? ALWAYS!
Stop Loss: When buying in a BULL market, always place your Stop loss at the last LOW or most recent level of Support. Why is this? Again,
when trading, you are dealing in probabilities. The last low, also being a Support level, should stop the market from moving lower. If the
market does move lower, this is exactly the point you would want to get out at! (Read more about the Stop Loss in our tutorial)
The exact opposite goes for a BEAR market. The last low or level of support, is at point A. Also work out how much equity you are required
to risk. Can you afford it? If not, do not enter the trade. Learn more about placing your stop loss.
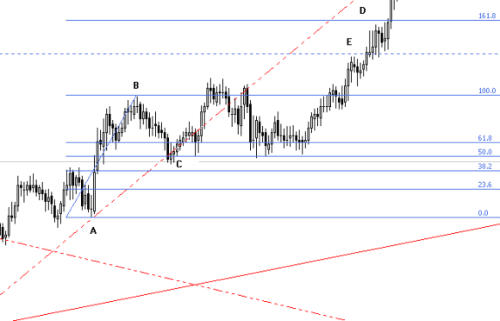
Diagram 3.
With the Stop loss positioned correctly at point A, the stop was never in danger of being triggered by the market. As seen above, our
Fibonacci tool also determines the related 1.618 profit level at point D.
The dotted line at point E indicates 2 things. Firstly the pause of the market at the 1.27 Fib level. Remember, with a Fib 0.618 bounce, there
will be a pause at the 1.27 level before the market completes the price swing at the extension at point D (1.618). It also represents a
Resistance level identified by the market, by a high not visible in the above diagram 3.