
© Copyright 2015 - FX Hometrader - All rights reserved.

Trading with the RSI Indicator
The Relative Strength Index or (RSI) was developed by J Wells Wilder as an oscillator indicator that compares the magnitude of recent gains to recent losses to determine when a market or commodity is overbought or oversold. Overbought An overbought situation is one where the demand for the asset, increases price to a level that unfairly outstrips the assets fundamentals. This could generally be interpreted as a sign that prices could start to retrace Oversold An oversold situation is one where price has rapidly decreased to below the true value of the asset. This is generally as a result of a sharp overreaction and panic selling by traders and could be an indication that prices will start to retrace.Learn how to trade with the RSI
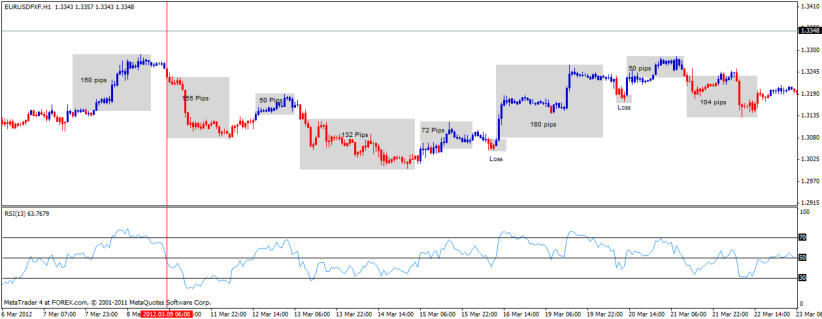
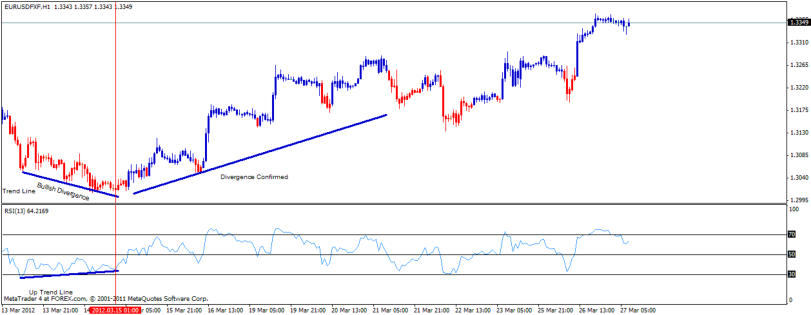
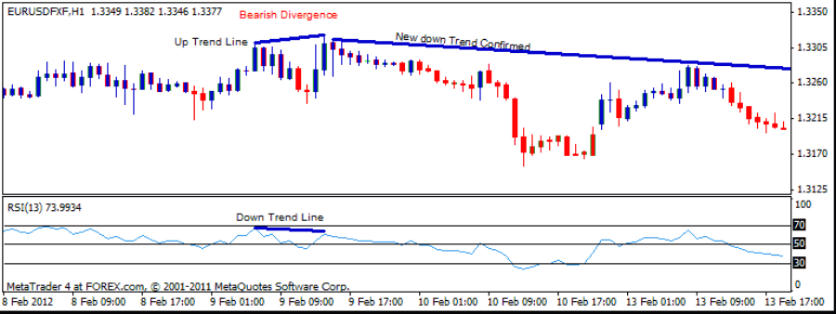
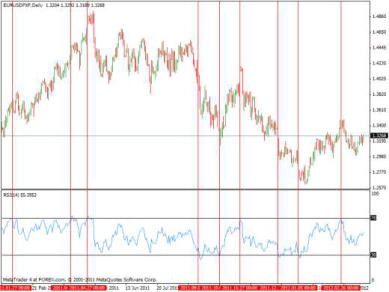
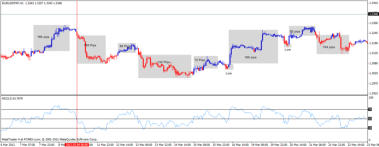
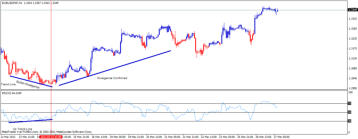
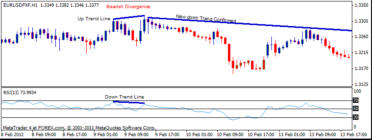
Although the RSI is thought to work best on a daily time frame, using the standard period setting of 14 we can see on the following chart that this method would suit position traders who are prepared to hold trading positions for extended periods of time. The following daily chart shows that there would only have been 13 trades signalled from Sept 2010 to 24 March 2012. Many of those trades would have resulted in fake outs or temporary retracements only to continue in the original direction. The secret however would be consistency by taking the same trade signals and eventually the true signals would yield far greater profits than the losses incurred. By reducing the period from 14 to say 10 resulting in a faster signal and the number of trades would have increased to 21 over the same period. This is based upon a buy signal where the RSI either touched or crossed below the thirty line; and the trade entered when the indicator again crossed above the 30 line. Sell signals that either touched or crossed above the 70 line and then crossed below the 70 line to enter a trade. The fact is the RSI can be used in various markets and time frames. In the next section we will examine a few different ways to trade the RSI. The first method we will examine is the overbought oversold signals. The following chart depicts overbought and oversold trades from 6 March 2012 to 21 March 2012. The above chart trades were executed when price crossed from overbought above the 70 line to below the 70 line at the close of the candle below the 70 line. Long trades were executed when price crossed below the 30 line and then entered at when price crossed back above the 30 line at the close of the candle. The above table records the totals from the trades on the chart showing a 75% win loss ratio and an overall risk to reward ration of almost 2 to 1. The most remarkable feature though is the amazingly small stops required to do the trades where the swing low or high + 10 pips has been used as the stop loss level, emphasizing the RSI’s ability to pick the turn in the market very early on. Another popular method is to use the RSI as a trend indicator and only enter trades once the RSI indicator has crossed through the 50% mark confirming the possibility of a new trend. On the above chart the candles have been programmed to represent an RSI indicator. When the candles are Blue then the RSI has crossed above the 50 line and when they are red they have crossed below the 50 line. The vertical led line confirms the RSI Cross and the candle changing from blue to red. The Strategy when the candles turn red enter a new short trade once the current candle breaks below the price of the first red candle. Once a candle turns blue we enter long at the break of the high of the first Blue candle. The previous pivot (Fractal) high/low can be used as a stop loss, whilst the TP should be 1.5 to 2 times the number of stop loss pips. The shaded areas of the above chart, shows the potential profits using the RSI as a trending indicator. Once again there were 10 trades with only 2 losses. Divergence As with all oscillators the RSI is a good indicator for identifying divergence and the following chart shows a bullish divergence resulting in a good long trade. The following chart shows a Bearish Divergence. As you can see the RSI is a solid versatile indicator that can cater for most trading environments. Obviously it’s not perfect but with the right discipline and consistency it has proved to be a worthwhile tool over the years, and can be combined with other indicators to confirm trades. *As always, good money management principals are the key to success with any trading strategy.

|
Trade |
Entry |
Stop Pips |
P/L |
|
1 |
1.3116 |
23 |
155 |
|
2 |
1.3270 |
31 |
160 |
|
3 |
1.3118 |
33 |
-33 |
|
4 |
1.3107 |
36 |
77 |
|
5 |
1.3182 |
20 |
103 |
|
6 |
1.3081 |
40 |
-40 |
|
7 |
1.3043 |
25 |
-25 |
|
8 |
1.3096 |
33 |
48 |
|
9 |
1.3233 |
25 |
0 |
|
10 |
1.3267 |
40 |
62 |
|
11 |
1.3267 |
26 |
90 |
|
12 |
1.3196 |
26 |
58 |
|
Totals |
|
358 |
655 |


- Forex Trading Chart Patterns
- Price Actions Charts
- Fibonacci Trading
- Fibonacchi Levels Tutorials
- Trading with the Elliott Wave
- Trading with Bollinger Bands
- Trading with the MACD
- Candlestick Trading Tutorial
- Pivot Points Trading
- Trading with the RSI Indicator
- Trading with the Stochastic Indicator
- Swing Trading Strategy
- Support and Resistance Levels
- Stop Loss Tutorial


© Copyright 2016 - FX Hometrader - All rights reserved.

Trading with the RSI
Indicator
The Relative Strength Index or (RSI) was developed by J Wells Wilder as an oscillator indicator that compares the magnitude of recent gains to recent losses to determine when a market or commodity is overbought or oversold. Overbought An overbought situation is one where the demand for the asset, increases price to a level that unfairly outstrips the assets fundamentals. This could generally be interpreted as a sign that prices could start to retrace Oversold An oversold situation is one where price has rapidly decreased to below the true value of the asset. This is generally as a result of a sharp overreaction and panic selling by traders and could be an indication that prices will start to retrace.Learn how to trade with the RSI
Although the RSI is thought to work best on a daily time frame, using the standard period setting of 14 we can see on the following chart that this method would suit position traders who are prepared to hold trading positions for extended periods of time. The following daily chart shows that there would only have been 13 trades signalled from Sept 2010 to 24 March 2012. Many of those trades would have resulted in fake outs or temporary retracements only to continue in the original direction. The secret however would be consistency by taking the same trade signals and eventually the true signals would yield far greater profits than the losses incurred. By reducing the period from 14 to say 10 resulting in a faster signal and the number of trades would have increased to 21 over the same period. This is based upon a buy signal where the RSI either touched or crossed below the thirty line; and the trade entered when the indicator again crossed above the 30 line. Sell signals that either touched or crossed above the 70 line and then crossed below the 70 line to enter a trade. The fact is the RSI can be used in various markets and time frames. In the next section we will examine a few different ways to trade the RSI. The first method we will examine is the overbought oversold signals. The following chart depicts overbought and oversold trades from 6 March 2012 to 21 March 2012. The above chart trades were executed when price crossed from overbought above the 70 line to below the 70 line at the close of the candle below the 70 line. Long trades were executed when price crossed below the 30 line and then entered at when price crossed back above the 30 line at the close of the candle. The above table records the totals from the trades on the chart showing a 75% win loss ratio and an overall risk to reward ration of almost 2 to 1. The most remarkable feature though is the amazingly small stops required to do the trades where the swing low or high + 10 pips has been used as the stop loss level, emphasizing the RSI’s ability to pick the turn in the market very early on. Another popular method is to use the RSI as a trend indicator and only enter trades once the RSI indicator has crossed through the 50% mark confirming the possibility of a new trend. On the above chart the candles have been programmed to represent an RSI indicator. When the candles are Blue then the RSI has crossed above the 50 line and when they are red they have crossed below the 50 line. The vertical led line confirms the RSI Cross and the candle changing from blue to red. The Strategy when the candles turn red enter a new short trade once the current candle breaks below the price of the first red candle. Once a candle turns blue we enter long at the break of the high of the first Blue candle. The previous pivot (Fractal) high/low can be used as a stop loss, whilst the TP should be 1.5 to 2 times the number of stop loss pips. The shaded areas of the above chart, shows the potential profits using the RSI as a trending indicator. Once again there were 10 trades with only 2 losses. Divergence As with all oscillators the RSI is a good indicator for identifying divergence and the following chart shows a bullish divergence resulting in a good long trade. The following chart shows a Bearish Divergence. As you can see the RSI is a solid versatile indicator that can cater for most trading environments. Obviously it’s not perfect but with the right discipline and consistency it has proved to be a worthwhile tool over the years, and can be combined with other indicators to confirm trades. *As always, good money management principals are the key to success with any trading strategy.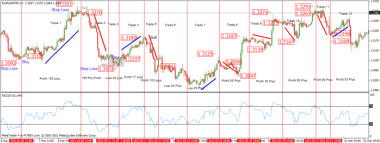
|
Trade |
Entry |
Stop Pips |
P/L |
|
1 |
1.3116 |
23 |
155 |
|
2 |
1.3270 |
31 |
160 |
|
3 |
1.3118 |
33 |
-33 |
|
4 |
1.3107 |
36 |
77 |
|
5 |
1.3182 |
20 |
103 |
|
6 |
1.3081 |
40 |
-40 |
|
7 |
1.3043 |
25 |
-25 |
|
8 |
1.3096 |
33 |
48 |
|
9 |
1.3233 |
25 |
0 |
|
10 |
1.3267 |
40 |
62 |
|
11 |
1.3267 |
26 |
90 |
|
12 |
1.3196 |
26 |
58 |
|
Totals |
|
358 |
655 |


- Home
- Introduction to Forex Trading
- Trading Requirements
- Forex Trading Times
- How to Choose Your Broker
- Brokerage Firms
- About Managed Accounts
- Technical Analysis Tutorials
- Forex Trading Tutorials
- Price Action Charts
- Fibonacci Trading
- Fibonacci Levels Tutorial
- Trading with the Elliott Wave
- Trading with Bollinger Bands
- Trading with MACD
- Candlestick Trading Tutorial
- Pivot Points Trading Tutorial
- Pivot Point Calculator
- Trading with the RSI Indicator
- Trading with the Stochastic Indicator
- Swing Trading Strategy
- Stop-Loss Tutorial
- Free Trading Magazines
- Free Trading Software
- Forex Trading Books
- Forex Trading Articles
- Glossary
- About Us
- Contact Us